We’ve now published our full response to our official statistics consultation.
Not too long ago, I published a blog asking our data users to give feedback about our annual official statistics. First of all, thanks to all the 85 respondents that took part in our consultation. It’s great that you were all so willing to help us keep our statistics relevant to you.
Results of the consultation
It’s been really helpful for us to collect information about our users. Knowing things like 'what our users do' and 'how you use our data' helps us to tailor our statistics to your needs.
Most users categorised themselves as working within the ‘business’ sector. Lower numbers (between 3 and 7) reported working in sectors relating to:
- local and national government
- voluntary
- journalist
- those classified as ‘other’
The next part of our survey focussed on what you use the data for. We found that the majority reported using the data for general background information. Despite this, all categories were chosen by at least 5 users. These categories were:
- research
- monitoring
- decision making
- inclusion in reports
- writing briefing
- policy development
- benchmarking
- modelling and/or forecasting
- do not use
We want to make sure we’re producing tables that are useful to you, so one question asked which tables you used within the annual publication. All were used, but the table with the most users was the ‘historic data’ table (A8 if you want the table number).
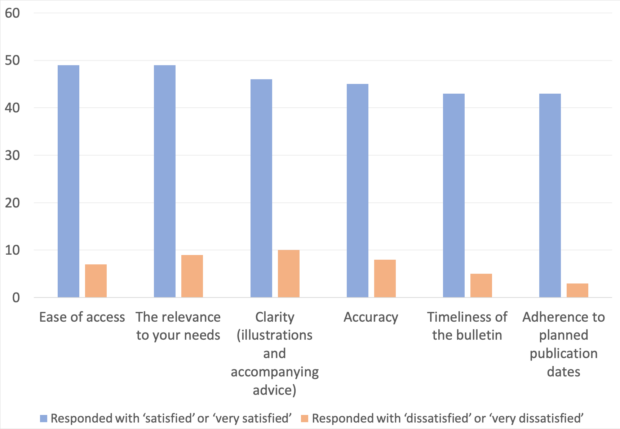
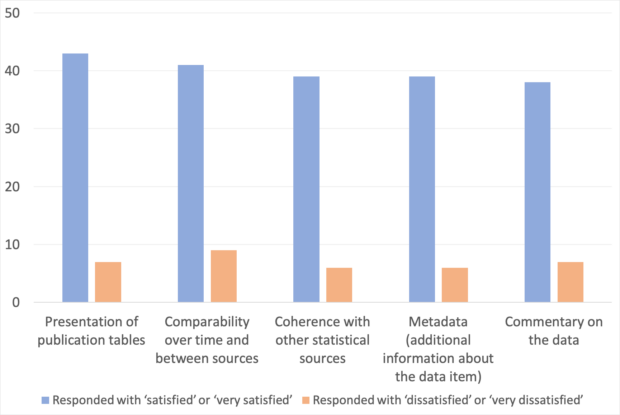
The next part of our survey asked users to give feedback on how satisfied you were with several aspects of the publication. These charts show that the respondents provided far more positive feedback compared to negative feedback.
Further comments
Some users provided feedback through the free-text comment boxes, which gave suggestions of what you’d like to see in further publications. The main themes from the comments were:
- further analysis of SIC data
- questioning the quality of the data
- more promotion of the statistics
- to make the data available in a machine-readable format
How we’ll use your feedback
From your comments and feedback, it looks like our official statistics won’t be changing too much. We were told that all the tables were used by several respondents, so we will continue producing these.
Although most respondents provided positive feedback, we’ll continue to keep in touch with our users to keep the data relevant.
| You said you would like… | …so we will |
| To see more promotion of the official statistics. | We’ll continue to work with our external communications team to promote our statistics on our social media platforms. This enables our data to reach a wider audience usual. We’ll also write occasional blogs to promote our official statistics. These blogs will include the key messages of the release. |
| Data to be made available in open, machine-readable formats such as JSON, XML or LibreOffice. | We’re investigating the feasibility of making the data available on request in these alternative formats. We’ll provide contact details for requests in due course. |
| Further analysis of standard industrial classification (SIC) code data. | We’re currently carrying out work to improve the way SIC code data is captured and recorded. Once this work is complete, we’ll expand our analysis in this area. |
If you would like any more information about the consultation, contact statistics@companieshouse.gov.uk.
To keep in touch, sign up to email updates from this blog or follow us on Twitter.