As the operator of the UK’s register of companies, we’re surrounded by data. Over 3.5 million companies use our services to file over 12 million documents every year. Find out how we collect, analyse and internally present data.
During 2015-2016, the register was searched over 780 million times. All this activity generates an enormous amount of data. We’ve been using some of this data to improve our services and operational efficiency for many years. However, over the last 18 months we’ve been working hard to make this data even more valuable.
Inspired by GOV.UK Performance, we’ve been building our own performance platform. Rather than being yet another internal system, the platform is our approach to ‘Big Insights’ – the collection, analysis and presentation of data.
Collection
We always start by understanding what data we need to collect, based on how success is going to be measured. We have an extensive range of internal processes, the majority of which collect data in transaction logs, databases and other log files. We’ve written scheduled scripts that automatically extract the datasets we need, convert it all to JSON format, and then compile them into a single source.
Another important source of performance data is obtained from website analytics. We use Piwik – a free, open source product. Because we have complete control and ownership of the data Piwik collects, we can develop bespoke programs using its API. We can also add value and visualise the data to allow deeper analysis and identify further insights about customer behaviour.
The data we need is in a constant, accessible format, so we can work on analysing and presenting information to those who need it most.
Analysis
Before we began to improve the value of our data, some reports were simply presented in spreadsheet format. Data had not been analysed, segmented or assessed to identify any actionable insights. The role of interpreting the data, understanding the context and identifying actions was left to the reader of the report. These reports often contained vanity metrics and aggregate data, which provided limited value to the reader and were often not read.
We’re now conducting meaningful data analysis rather than simply reporting.
As well as using data from different sources to build a picture of what might be happening, we also rely on historical data to help identify seasonal anomalies or trends. We spend time with subject matter experts from across Companies House to build context, and make sense of patterns in customer behaviour. We also work very closely with our in-house customer insight team. The team spends most of their time talking to our customers: through usability testing; at events; or via a number of customer survey methods.
All of this helps us to truly understand not only what is happening, but why. With this context, we can present the reader with actionable insights and recommendations for improvement.
Presentation
We’re continually using and analysing data to identify how well we are performing against our business objectives and goals. We’re translating this performance data into visually compelling, real-time dashboards that make the data easy to understand, create a shared view of the data and allow prompt action to be taken if required. This collection of visual dashboards is the bit of the Performance Platform that people can actually see.
The vision for the platform is to: create a clear, shared view of performance data to unlock actionable insights and enable informed decision making to meet our objectives and improve performance.
Our platform is very similar in look and feel to the GOV.UK Performance Platform. We use Highcharts, a JavaScript charting library to extract and visualise data. In addition, the platform is available to everyone in Companies House and dashboards can be seen on TV monitors throughout the office.
The design of each dashboard is driven by the need of the target audience. We need to understand who will use the dashboard and how they will use it. We then work closely with them to find out what data they need to make informed decisions that will improve the performance of the team or our products and services.
We currently have three different categories of dashboards:
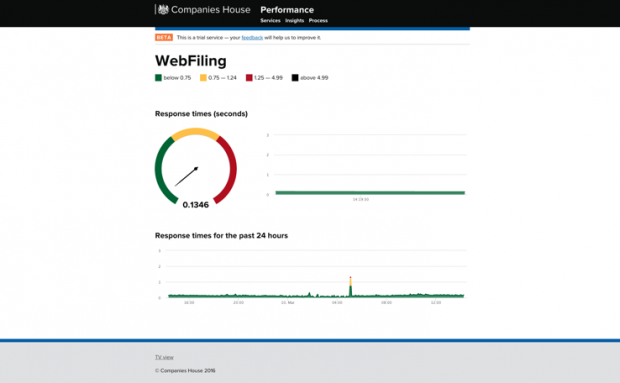
Service dashboards: These show how well an individual service is performing. These include dashboards to show live response times and activity on our digital services. They’re used by IT support teams to ensure the services are meeting our performance targets. They’re also used by customer facing teams enabling them to have a real-time view of service performance so they can advise our customers accordingly.
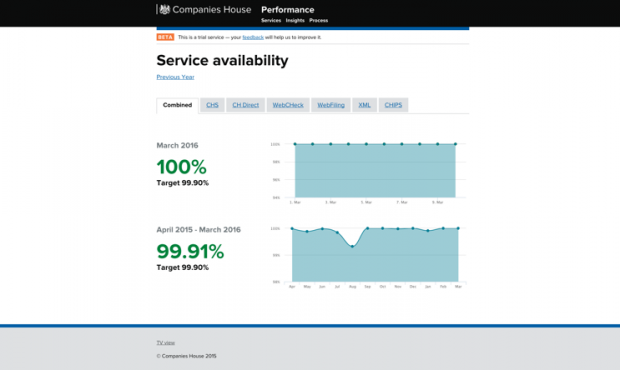
There’s also a dashboard to show service availability across all services for the day, month and year.
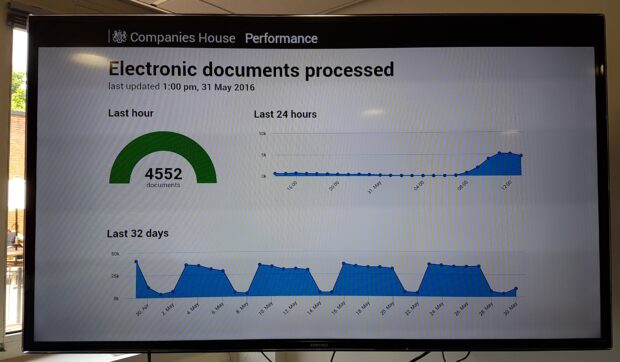
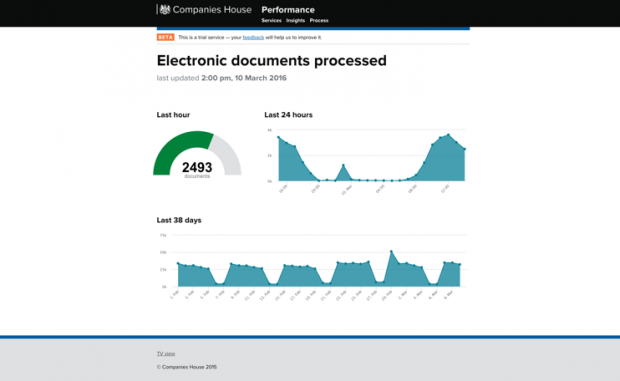
Process dashboards: These show the performance of internal processing functions. These dashboards include the number of documents processed in last hour, day and month.
Delivering a digital product to a non-digital area means everyone has the capability to see how well their team or products are performing and identify where improvements can be made. Fluctuation and trends in processing volumes can be easily identified from the graphs over the day, week and month – enabling managers to make informed decisions concerning effective allocation of resources.
Insight dashboards: As a performance analyst these are the dashboards I love to create. The dashboards not only show the key metrics for the service, they explain the key insights identified based on the quantitative and qualitative evidence and make recommendations to improve performance or to prompt further investigation or analysis.
The dashboard for the Companies House Service shows the key metrics for the service using the Acquisition Behaviour Outcome (ABO) framework. We can see at a glance the performance of the service for the month and compare that to previous months using the sparklines.
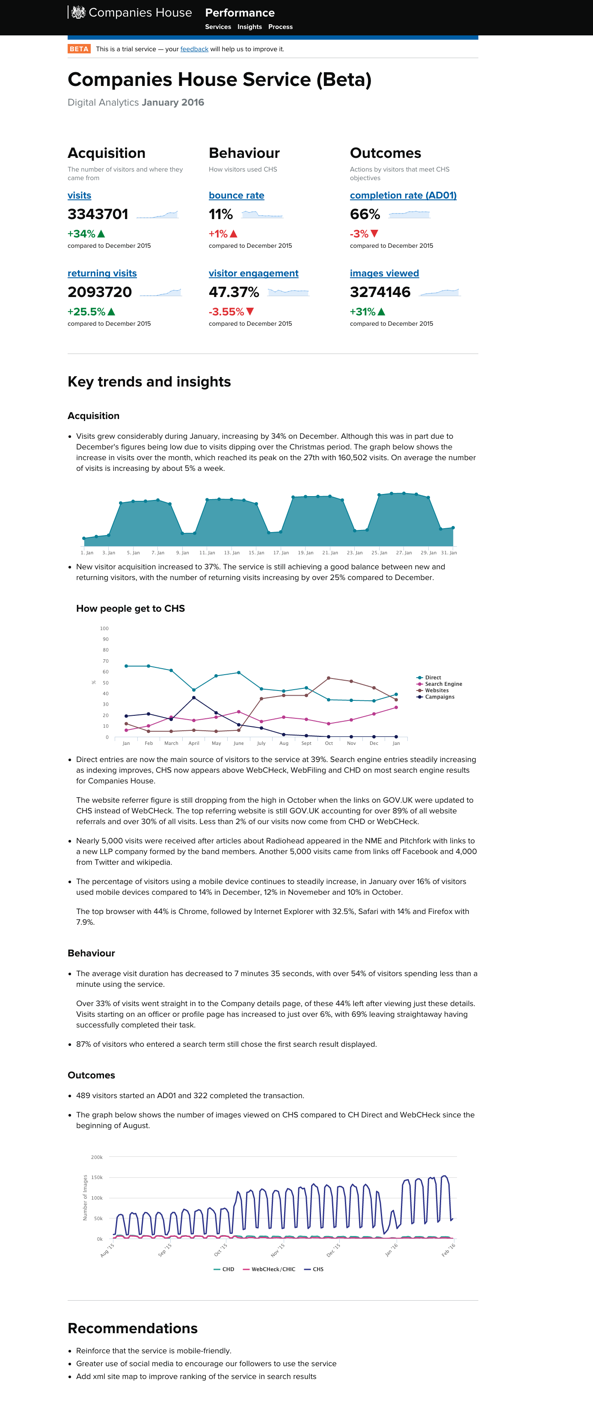
But the Insight dashboards don't just quote metrics, they delve deeper into customer behaviour and highlight the key trends and insights for that month.
We’re continually analysing how are customers are using the Companies House Service from analytics and also from customer feedback, user research, AB testing, etc. The dashboard outlines insight gained from analysis of this quantitative and qualitative data and recommends actions that should be taken, highlighting the impact this action will have on service performance.
Furthermore, we’ve recently developed a social media dashboard so we can measure how well our social media strategy is performing and identify how we can make improvements to help our customers. We can also identify how effective our social media strategy has been in increasing traffic to our services.
Finally, we’re developing a dashboard to show the roadmap for the Performance Platform. Users will know what dashboards are being planned and when they can expect them to be available – a dashboard for dashboards!
Continual improvement
We’re continually iterating the current dashboards based on feedback and designing more based on user needs. We want the Performance Platform to be the single place that everyone in Companies House visits to view clear, real-time performance data. Ultimately we want the dashboards to enable action and informed decision making that will improve our products and services for our customers.
To keep in touch, sign up to email updates from this blog, or follow us on Twitter.